Dynatrace
Splunk
Jprofiler
JMC(JDK Mission Control)
Traditional tool will be no use for testing Spring boot based application where there is no UI, fully java based application. To test out those kind application, there is no alternative to use Java MicroBenchmark Harness to perform the perform the performance testing.
JMH is short for Java Microbenchmark Harness. JMH is a toolkit that helps you implement Java microbenchmarks correctly. JMH is developed by the same people who implement the Java virtual machine, so these guys know what they are doing. This JMH tutorial will teach you how to implement and run Java microbenchmarks with JMH.
Writing benchmarks that correctly measure the performance of a small part of a larger application is hard. There are many optimizations that the JVM or underlying hardware may apply to your component when the benchmark executes that component in isolation. These optimizations may not be possible to apply when the component is running as part of a larger application. Badly implemented microbenchmarks may thus make you believe that your component's performance is better than it will be in reality.
Writing a correct Java microbenchmark typically entails preventung the optimizations the JVM and hardware may apply during microbenchmark execution which could not have been applied in a real production system. That is what JMH - the Java Microbenchmark Harness - is helping you do.
The easiest way to get started with JMH is to generate a new JMH project using the JMH Maven archetype. The JMH Maven archetype will generate a new Java project with a single, example benchmark Java class, and a Maven pom.xml file. The Maven pom.xml file contains the correct dependencies to compile and build your JMH microbenchmark suite.
Here is the Maven command line needed to generate a JMH project template:
 mvn archetype:generate
          -DinteractiveMode=false
          -DarchetypeGroupId=org.openjdk.jmh
          -DarchetypeArtifactId=jmh-java-benchmark-archetype
          -DgroupId=com.jenkov
          -DartifactId=first-benchmark
          -Dversion=1.0
This is one long command. There should be no line breaks in the command. I just added them to make the command easier to read.
This command line will create a new directory named first-benchmark (the artifactId specified in the Maven command). Inside this directory will be generated a new Maven source directory structure (src/main/java). Inside the java source root directory will be generated a single Java packaged named com.jenkov (actually a package named com with a subpackage named jenkov). Inside the com.jenkov package will be a JMH benchmark Java class named MyBenchmark.
It is time to write your first JMH benchmark class, or at least see how it is done.
The generated MyBenchmark class is a JMH class template which you can use to implement your JMH benchmarks. You can either implement your benchmarks directly in the generated MyBenchmark class, or create a new class in the same Java package. To make it easy for you to write your first JMH benchmark I will just use the generated class in this example.
Here is first how the generated MyBenchmark class looks:
package com.jenkov;

import org.openjdk.jmh.annotations.Benchmark;

public class MyBenchmark {

    @Benchmark
    public void testMethod() {
        // This is a demo/sample template for building your JMH benchmarks. Edit as needed.
        // Put your benchmark code here.
    }

}
You can put the code you want to measure inside the testMethod() method body. Here is an example:
package com.jenkov;

import org.openjdk.jmh.annotations.Benchmark;

public class MyBenchmark {

    @Benchmark
    public void testMethod() {
        // This is a demo/sample template for building your JMH benchmarks. Edit as needed.
        // Put your benchmark code here.

        int a = 1;
        int b = 2;
        int sum = a + b;
    }

}
Note: This particular example is a bad benchmark implementation, as the JVM can see that sum is never used, and may thus eliminate the sum calculation. Well in fact the whole method body could be removed by JVM dead code elimination. For now, just imagine that the testMethod() body actually contained a good benchmark implementation. I will get back how to implement better benchmarks with JMH later in this tutorial.
You can now compile and build a benchmark JAR file from your JMH benchmark project using this Maven command:
mvn clean install
This Maven command must be executed from inside the generated benchmark project directory (in this example the first-benchmark directory).
When this command is executed a JAR file will be created inside the first-benchmark/target directory. The JAR file will be named benchmarks.jar
When you build your JMH benchmarks, Maven will always generate a JAR file named benchmarks.jar in the target directory (Maven's standard output directory).
The benchmarks.jar file contains everything needed to run your benchmarks. It contains your compiled benchmark classes as well as all JMH classes needed to run the benchmark.
If your benchmarks has any external dependencies (JAR files from other projects needed to run your benchmarks), declare these dependencies inside the Maven pom.xml, and they will be included in the benchmarks.jar too.
Since benchmarks.jar is fully self contained, you can copy that JAR file to another computer to run your JMH benchmarks on that computer.
Once you have built your JMH benchmark code you can run the benchmark using this Java command:
java -jar target/benchmarks.jar
This will start JMH on your benchmark classes. JMH will scan through your code and find all benchmarks and run them. JMH will print out the results to the command line.
Running the benchmarks will take some time. JMH makes several warm ups, iterations etc. to make sure the results are not completely random. The more runs you have, the better average performance and high / low performance information you get.
You should let the computer alone while it runs the benchmarks, and you should close all other applications (if possible). If your computer is running other applications, these applications may take time from the CPU and give incorrect (lower) performance numbers.
JMH can run your benchmarks in different modes. The benchmark mode tells JMH what you want to measure. JMH offer these benchmark modes:
| Throughput | Measures the number of operations per second, meaning the number of times per second your benchmark method could be executed. |
| Average Time | Measures the average time it takes for the benchmark method to execute (a single execution). |
| Sample Time | Measures how long time it takes for the benchmark method to execute, including max, min time etc. |
| Single Shot Time | Measures how long time a single benchmark method execution takes to run. This is good to test how it performs under a cold start (no JVM warm up). |
| All | Measures all of the above. |
The default benchmark mode is Throughput.
You specify what benchmark mode your benchmark should use with the JMH annotation BenchmarkMode. You put the BenchmarkMode annotation on top of your benchmark method. Here is a JMH BenchmarkMode example:
package com.jenkov;

import org.openjdk.jmh.annotations.Benchmark;
import org.openjdk.jmh.annotations.BenchmarkMode;
import org.openjdk.jmh.annotations.Mode;

public class MyBenchmark {

    @Benchmark @BenchmarkMode(Mode.Throughput)
    public void testMethod() {
        // This is a demo/sample template for building your JMH benchmarks. Edit as needed.
        // Put your benchmark code here.

        int a = 1;
        int b = 2;
        int sum = a + b;
    }

}
Notice the @BenchmarkMode(Mode.Throughput) annotation above the testMethod() method. That annotation specifies the benchmark mode. The Mode class contains constants for each possible benchmark mode.
JMH enables you to specify what time units you want the benchmark results printed in. The time unit will be used for all benchmark modes your benchmark is executed in.
You specify the benchmark time unit using the JMH annotation @OutputTimeUnit. The @OutputTimeUnit annotation takes a java.util.concurrent.TimeUnit as parameter to specify the actual time unit to use. Here is a JMH @OutputTimeUnit annotation example:
package com.jenkov;

import org.openjdk.jmh.annotations.Benchmark;
import org.openjdk.jmh.annotations.BenchmarkMode;
import org.openjdk.jmh.annotations.Mode;
import org.openjdk.jmh.annotations.OutputTimeUnit;

import java.util.concurrent.TimeUnit;

public class MyBenchmark {

    @Benchmark @BenchmarkMode(Mode.Throughput) @OutputTimeUnit(TimeUnit.MINUTES)
    public void testMethod() {
        // This is a demo/sample template for building your JMH benchmarks. Edit as needed.
        // Put your benchmark code here.

        int a = 1;
        int b = 2;
        int sum = a + b;
    }

}
In this example the time unit specified is minutes. This means that you want the output shown using the time unit minutes (e.g. operations per minute).
The TimeUnit class contains the following time unit constants:
Sometimes you way want to initialize some variables that your benchmark code needs, but which you do not want to be part of the code your benchmark measures. Such variables are called "state" variables. State variables are declared in special state classes, and an instance of that state class can then be provided as parameter to the benchmark method. This may sound a bit complicated, so here is a JMH benchmark state example:
package com.jenkov;

import org.openjdk.jmh.annotations.*;

import java.util.concurrent.TimeUnit;


public class MyBenchmark {

    @State(Scope.Thread)
    public static class MyState {
        public int a = 1;
        public int b = 2;
        public int sum ;
    }


    @Benchmark @BenchmarkMode(Mode.Throughput) @OutputTimeUnit(TimeUnit.MINUTES)
    public void testMethod(MyState state) {
        state.sum = state.a + state.b;
    }

}
In this example I have added a nested static class named MyState. The MyState class is annotated with the JMH @State annotation. This signals to JMH that this is a state class. Notice that the testMethod() benchmark method now takes an instance of MyState as parameter.
Notice also that the testMethod() body has now been changed to use the MyState object when performing its sum calculation.
A state object can be reused across multiple calls to your benchmark method. JMH provides different "scopes" that the state object can be reused in. There state scope is specified in the parameter of the @State annotation. In the example above the scope chosen was Scope.Thread
The Scope class contains the following scope constants:
| Thread | Each thread running the benchmark will create its own instance of the state object. |
| Group | Each thread group running the benchmark will create its own instance of the state object. |
| Benchmark | All threads running the benchmark share the same state object. |
A JMH state class must obey the following rules:
publicstatic (e.g. public static class ...)When these rules are obeyed you can annotate the class with the @State annotation to make JMH recognize it as a state class.
You can annotate methods in your state class with the @Setup and @TearDown annotations. The @Setup annotation tell JMH that this method should be called to setup the state object before it is passed to the benchmark method. The @TearDown annotation tells JMH that this method should be called to clean up ("tear down") the state object after the benchmark has been executed.
The setup and tear down execution time is not included in the benchmark runtime measurements.
Here is a JMH state object example that shows the use of the @Setup and @TearDown annotations:
package com.jenkov;

import org.openjdk.jmh.annotations.*;

import java.util.concurrent.TimeUnit;


public class MyBenchmark {

    @State(Scope.Thread)
    public static class MyState {

        @Setup(Level.Trial)
        public void doSetup() {
            sum = 0;
            System.out.println("Do Setup");
        }

        @TearDown(Level.Trial)
        public void doTearDown() {
            System.out.println("Do TearDown");
        }

        public int a = 1;
        public int b = 2;
        public int sum ;
    }

    @Benchmark @BenchmarkMode(Mode.Throughput) @OutputTimeUnit(TimeUnit.MINUTES)
    public void testMethod(MyState state) {
        state.sum = state.a + state.b;
    }
}
Notice the two new methods in the MyState class named doSetup() and doTearDown(). These methods are annotated with the @Setup and @TearDown annotations. This example only show two methods, but you could have more methods annotated with @Setup and @TearDown.
Notice also that the annotations take a parameter. There are three different values this parameter can take. The value you set instruct JMH about when the method should be called. The possible values are:
| Level.Trial | The method is called once for each time for each full run of the benchmark. A full run means a full "fork" including all warmup and benchmark iterations. |
| Level.Iteration | The method is called once for each iteration of the benchmark. |
| Level.Invocation | The method is called once for each call to the benchmark method. |
If you have any doubts about when a setup or tear down method is called, try inserting a System.out.println() statement in the method. Then you will see. Then you can change the @Setup and @TearDown() parameter values until your setup and tear down methods are called at the right time.
Now that you have seen how to use JMH to write benchmarks, it is time to discuss how to write good benchmarks. As mentioned in the beginning of this JMH tutorial there are a couple of pitfalls that you can easily fall into when implementing benchmarks. I will discuss some of these pitfalls in the following sections.
One common pitfall is that the JVM may apply optimizations to your components when executed inside the benchmark which could not have been applied if the component was executed inside your real application. Such optimizations will make your code look faster than it will be in reality. I will discuss some of these optimizations later.
It is tempting to put your benchmark code inside a loop in your benchmark methods, in order to repeat it more times per call to the benchmark method (to reduce the overhead of the benchmark method call). However, the JVM is very good at optimizing loops, so you may end up with a different result than what you expected. In general you should avoid loops in your benchmark methods, unless they are part of the code you want to measure (and not around the code you want to measure).
One of the JVM optimizations to avoid when implementing performance benchmarks is dead code elimination. If the JVM detects that the result of some computation is never used, the JVM may consider this computation dead code and eliminate it. Look at this benchmark example:
package com.jenkov;

import org.openjdk.jmh.annotations.Benchmark;

public class MyBenchmark {

    @Benchmark
    public void testMethod() {
        int a = 1;
        int b = 2;
        int sum = a + b;
    }

}
The JVM can detect that the calculation of a + b which is assigned to sum is never used. Therefore the JVM can remove the calculation of a + b altogether. It is considered dead code. The JVM can then detect that the sum variable is never used, and that subsequently a and b are never used. They too can be eliminated.
In the end, there is no code left in the benchmark. The results from running this benchmark are thus highly misleading. The benchmarks do not actually measure the time of adding two variables and assigning the value to a third variable. The benchmarks measure nothing at all.
To avoid dead code elimination you must make sure that the code you want to measure does not look like dead code to the JVM. There are two ways to do that.
I will show you examples of both methods in the following sections.
Returning a computed value from the JMH benchmark method could look like this:
package com.jenkov;

import org.openjdk.jmh.annotations.Benchmark;

public class MyBenchmark {

    @Benchmark
    public int testMethod() {
        int a = 1;
        int b = 2;
        int sum = a + b;

        return sum;
    }

}
Notice how the testMethod() method now returns the sum variable. This way the JVM cannot just eliminate the addition, because the return value might be used by the caller. JMH will take of tricking the JVM into believing that the return value is actually used.
If your benchmark method is calculating multiple values that might end up being eliminated as dead code, you can either combine the two values into a single, and return that value (e.g. an object with both values in).
An alternative to returning a combined value is to pass the calculated values (or returned / generated objects or whatever the result of your benchmark is) into a JMH black hole. Here is how passing values into a black hole looks:
package com.jenkov;

import org.openjdk.jmh.annotations.Benchmark;
import org.openjdk.jmh.infra.Blackhole;

public class MyBenchmark {

    @Benchmark
   public void testMethod(Blackhole blackhole) {
        int a = 1;
        int b = 2;
        int sum = a + b;
        blackhole.consume(sum);
    }
}
Notice how the testMethod() benchmark method now takes a Blackhole object as parameter. This will be provided to the test method by JMH when called.
Notice also how the calculated sum in the sum variable is now passed to the consume() method of the Blackhole instance. This will fool the JVM into thinking that the sum variable is actually being used.
If your benchmark method produces multiple results you can pass each of these results to a black hole, meaning calling consume() on the Blackhole instance for each value.
Constant folding is another common JVM optimization. A calculation which is based on constants will often result in the exact same result, regardless of how many times the calculation is performed. The JVM may detect that, and replace the calculation with the result of the calculation.
As an example, look at this benchmark:
package com.jenkov;

import org.openjdk.jmh.annotations.Benchmark;

public class MyBenchmark {

    @Benchmark
    public int testMethod() {
        int a = 1;
        int b = 2;
        int sum = a + b;

        return sum;
    }

}
The JVM may detect that the value of sum is based on the two constant values 1 and 2 in a and b. It may thus replace the above code with this:
package com.jenkov;

import org.openjdk.jmh.annotations.Benchmark;

public class MyBenchmark {

    @Benchmark
    public int testMethod() {
        int sum = 3;

        return sum;
    }

}
Or even just return 3; directly. The JVM could even continue and never call the testMethod() because it knows it always returns 3, and just inline the constant 3 wherever the testMethod() was to be called.
To avoid constant folding you must not hardcode constants into your benchmark methods. Instead, the input to your calculations should come from a state object. This makes it harder for the JVM to see that the calculations are based on constant values. Here is an example:
package com.jenkov;

import org.openjdk.jmh.annotations.*;

public class MyBenchmark {

    @State(Scope.Thread)
    public static class MyState {
        public int a = 1;
        public int b = 2;
    }


    @Benchmark
    public int testMethod(MyState state) {
        int sum = state.a + state.b;
        return sum;
    }
}
Remember, if your benchmark method calculates multiple values you can pass them through a black hole instead of returning them, to also avoid the dead code elimination optimization. For instance:
    @Benchmark
    public void testMethod(MyState state, Blackhole blackhole) {
        int sum1 = state.a + state.b;
        int sum2 = state.a + state.a + state.b + state.b;

        blackhole.consume(sum1);
        blackhole.consume(sum2);
    }
Application Performance Index, or Apdex, is a measurement of your users’ level of satisfaction based on the response time of request(s) when interacting with your website or application.
First off, the application or website owner is responsible for defining the target response time (based on their performance goals), known throughout this article as T (time) where all requests handled in T, or less, are “satisfactory” for your users.
The Apdex method takes your defined response time threshold (T), the sum of satisfactory response times plus half of the tolerable response times divided by the total number of samples (requests sampled) in order to calculate a ratio from 0 to 1. (0 being unsatisfactory and 1 being satisfactory) See equation for Apdex below:
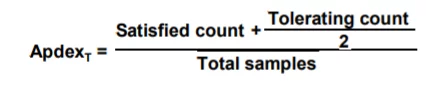
Let’s break down each part of this equation:
Thus, the resulting application performance index is a numerical measure of user satisfaction based on the response time to x requests of a website or application.
In this example, we will use a website or application that receives 400 requests in 3 minutes where our Apdex threshold or T is set to 0.5 seconds (500ms). Let’s say that 270 requests were handled within 500ms, which qualifies as “Satisfactory” range. Then, 70 requests were handled between 500ms and 2 seconds (2000 ms), which would be in the “Tolerable” range. Lastly, the 60 remaining requests were either not handled properly or took longer than 2 seconds, so they would fall in the “Frustrated” range. Thus giving us an Apdex score of 0.76: (270 + (70/2))/400 = 0.76.
Apdex averages your score in a range from 0-1, indicating where the digital experience offered to your users falls in the “satisfaction” range. Here are some of the levels you may find your website or application to be scored at with Apdex:
The average Apdex score is 0.85 so if you are anywhere near that range, you’re doing something right.
This Apdex score is also useful, for example, with transaction tracing as it provides insights into what requests or transactions are causing slow scripts on your page. So what comes next? After you define your Apdex levels, are you done? No! This is just one part of your overall Real User Monitoring strategy.
Here are some ways to improve your Apdex Score:
Most importantly, invest in a comprehensive real user monitoring solution. To help you get started, we reviewed some of the best RUM tools available today.
Apdex is centered around one key performance metric, response time based on x number of samples, so it’s unrealistic to say that with this simple KPI you are truly monitoring your users’ digital experience. Let’s look at why.
Response time values don’t take into account the time on the page, engagements, clicks, conversion rates, etc. and also can be less accurate when working with user data that has different locations, browser types, connection types, etc. If you’re not new to application performance, and how it works, you should instantly acknowledge that all application or website requests perform at very different levels. For example, your “Search for Hotels” request-response time will be much higher than your “View Hotel” response time. These two clearly different requests should not be constrained to the same time-based threshold.
For load testing, you must run JMeter in this mode (Without the GUI) to get the optimal results from it. To do so, use the following command options:
The script also lets you specify the optional firewall/proxy server information:
As for example:
C:\MyApache\apache-jmeter-5.4.1\bin>jmeter -n -t C:\MyApache\Project\PerformanceTesting2021.jmx -l C:\MyApache\Project\Result\log10.jtl -e -o C:\MyApache\Project\Result\report
You can generate the HTML report using menu item Tools → Generate HTML report:
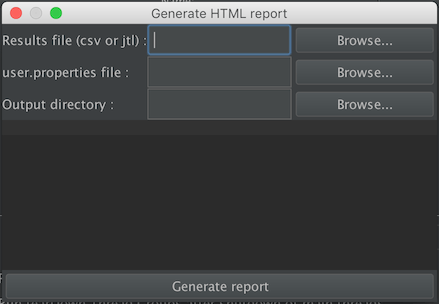
For each parameters see the following table :
If no output directory is defined, the controller will use ${JMETER_HOME}/bin/report-output.
You then only have to click on the Generate report button and wait for an information dialog to appear
jmeter -g <log file> -o <Path to output folder>
Use the following command:
jmeter -n -t <test JMX file> -l <test log file> -e -o <Path to output folder>
Answer: Here are a few notes to help you on your way.
You have:
While you are developing your scripts and for only moderate levels of user testing (assuming you are "close" to the application server) you do not need to involve any JMeterEngine machines.
The reason you have these are to:
Note that if the GUI is running multiple remote servers, it can easily become a bottle-neck, especially if a lot of listeners are being used. Remove all unnecessary listeners before running stress tests.
Running JMeter in non-GUI (batch) mode is preferable, as this uses far fewer resources. The output log files can be merged after the test run and used to create overall test statistics. (CVS files can just be appended to each other; XML output files need a bit of editting to maintain well-formedness.)
If there are several nodes running the JMeter test plan, it is a good idea to try and ensure that their clocks are synchronised, as this makes it easier to analyse the data later.
product_id=(\w*-\w*-\w*) $1$ 0 (Setting this parameter to 0 returns a random match)/estore/control/product product_id , value to ${product }When you view the results in the View Results Tree, you can see the ${product} value was replaced with the value extracted by the regular expression.
Answer: You can display your server's response text in the View Results Tree listener.
Answer: Assertions aren't smart enough to do the right thing with redirected requests - currently the 302 response would be asserted against. You can get around this by recording your test plans and leaving "follow redirects" off.
Alternatively, the latest JMeter release (after 1.9.1) has an option to allow the redirects to be handled by the Java libary routines. Earlier versions of Java did not support redirects properly, but if you want to try, just define the following JMeter property:
HTTPSampler.delegateRedirects=true
JMeter will then not see the redirects at all.
Just insert an HTTP Cookie Manager. This keeps track of all cookies for each thread within the thread group. Without http cookie manager, each request is a new session as cookies are not kept. jsessionid is only shown for the very first request, subsequent request will not see the jsessionid. to use a variable in jmeter is ${name of variable}.
This is very useful when dealing with jsp form logins, as the first request is to login to the system and subsequent request is to do load testing on the target page. This will prevent redirection back into login page.
Flow control Syntax break Exit a loop. continue Exit the current iteration of the loop and proceed with the next iteration. Ctrl+C Key com...

