Wednesday, November 17, 2021

What Is Apdex Score: Definition, Calculation & How to Improve It


Definition: What Is Apdex Score (Application Performance Index)?

Application Performance Index, or Apdex, is a measurement of your users’ level of satisfaction based on the response time of request(s) when interacting with your website or application.

How Does Apdex Work?

First off, the application or website owner is responsible for defining the target response time (based on their performance goals), known throughout this article as T (time) where all requests handled in T, or less, are “satisfactory” for your users.

How Is Apdex Score Calculated: The Formula

The Apdex method takes your defined response time threshold (T), the sum of satisfactory response times plus half of the tolerable response times divided by the total number of samples (requests sampled) in order to calculate a ratio from 0 to 1. (0 being unsatisfactory and 1 being satisfactory) See equation for Apdex below:

apdex score calculation

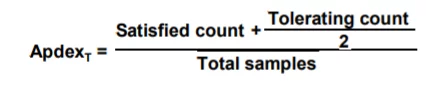
This  image was taken from Application Performance Index – Apdex Technical Specification

Let’s break down each part of this equation:

  1. T = desired or defined latency of request (as defined by you)
  2. Satisfied count = number of samples (or requests) that received a response in T or less
  3. Tolerating count = number of samples (or requests) that are 4 times T or less
  4. Total samples = Total number of requests used to calculate your Apdex score

Thus, the resulting application performance index is a numerical measure of user satisfaction based on the response time to requests of a website or application.

Example of an Apdex score

In this example, we will use a website or application that receives 400 requests in 3 minutes where our Apdex threshold or T is set to 0.5 seconds (500ms). Let’s say that 270 requests were handled within 500ms, which qualifies as “Satisfactory” range. Then, 70 requests were handled between 500ms and 2 seconds (2000 ms), which would be in the “Tolerable” range. Lastly, the 60 remaining requests were either not handled properly or took longer than 2 seconds, so they would fall in the “Frustrated” range. Thus giving us an Apdex score of 0.76: (270 + (70/2))/400 = 0.76.

What Is a Good Apdex Score?

Apdex averages your score in a range from 0-1, indicating where the digital experience offered to your users falls in the “satisfaction” range. Here are some of the levels you may find your website or application to be scored at with Apdex:

  • 1.00-0.94 = Excellent
  • 0.93-0.85 = Good
  • 0.84-0.70 = Fair
  • 69 and 0.49 = Poor
  • >0.49 = Bad

The average Apdex score is 0.85 so if you are anywhere near that range, you’re doing something right.

This Apdex score is also useful, for example, with transaction tracing as it provides insights into what requests or transactions are causing slow scripts on your page. So what comes next? After you define your Apdex levels, are you done? No! This is just one part of your overall Real User Monitoring strategy.

How to Improve Your Apdex Score?

Here are some ways to improve your Apdex Score:

  1. Minimize HTTP requests
  2. Remove third-party code that is not functioning correctly
  3. Test your releases before moving them to production to ensure maximum performance

Most importantly, invest in a comprehensive real user monitoring solution. To help you get started, we reviewed some of the best RUM tools available today.

Why Monitoring Your Apdex Score Is NOT Enough?

Apdex is centered around one key performance metric, response time based on number of samples, so it’s unrealistic to say that with this simple KPI you are truly monitoring your users’ digital experience. Let’s look at why.

Response time values don’t take into account the time on the page, engagements, clicks, conversion rates, etc. and also can be less accurate when working with user data that has different locations, browser types, connection types, etc. If you’re not new to application performance, and how it works, you should instantly acknowledge that all application or website requests perform at very different levels. For example, your “Search for Hotels” request-response time will be much higher than your “View Hotel” response time. These two clearly different requests should not be constrained to the same time-based threshold.

Thursday, April 8, 2021

How to run test in Non-GUI mode and generate html report?

For load testing, you must run JMeter in this mode (Without the GUI) to get the optimal results from it. To do so, use the following command options:

-n
This specifies JMeter is to run in cli mode
-t
[name of JMX file that contains the Test Plan].
-l
[name of JTL file to log sample results to].
-j
[name of JMeter run log file].
-r
Run the test in the servers specified by the JMeter property "remote_hosts"
-R
[list of remote servers] Run the test in the specified remote servers
-g
[path to CSV file] generate report dashboard only
-e
generate report dashboard after load test
-o
output folder where to generate the report dashboard after load test. Folder must not exist or be empty

The script also lets you specify the optional firewall/proxy server information:

-H
[proxy server hostname or ip address]
-P
[proxy server port]


As for example:

C:\MyApache\apache-jmeter-5.4.1\bin>jmeter -n -t C:\MyApache\Project\PerformanceTesting2021.jmx -l C:\MyApache\Project\Result\log10.jtl  -e -o C:\MyApache\Project\Result\report

Wednesday, March 10, 2021

How to Generate an HTML reports?


Generation using GUI Tools menu

You can generate the HTML report using menu item Tools → Generate HTML report:

Figure 14.1. HTML Report Dialog Menu

For each parameters see the following table :

Parameters

Attribute
 
Description
 
Required
Results file (csv or jtl)
 
The CSV output of a tes run
 
Yes
user.properties file
 
The user.properties file used to run the load test
 
Yes
Output directory
 
The directory where you want the report to be created(must be empty)
 
No

If no output directory is defined, the controller will use ${JMETER_HOME}/bin/report-output.

You then only have to click on the Generate report button and wait for an information dialog to appear

If report generation takes more than two minutes, adjust the property generate_report_ui.generation_timeout

Generation from an existing sample CSV log file

Use the following command:

jmeter -g <log file> -o <Path to output folder>

Generation after load test

Use the following command:

jmeter -n -t <test JMX file> -l <test log file> -e -o <Path to output folder>

How to do remote testing the 'proper way'?


Answer: Here are a few notes to help you on your way.

You have:

  1. Your application server. You shouldn't run anything on this machine that you wouldn't have running on it in your proposed or actual production environment (if you are running anything else, including JMeter, you will be adding load to the server and thus tainting your results).
  2. One or more machines running jmeter-server (the JMeterEngine). You want these machines to be reasonably close (network wise) to the application server. By "reasonably close" I mean on the same Ethernet segment or at least with no low speed links between them. The JMeter User Manual provides reasonable information about doing this.
  3. A single machine running the JMeter GUI that you use to control the machines running the JMeterEngine.

While you are developing your scripts and for only moderate levels of user testing (assuming you are "close" to the application server) you do not need to involve any JMeterEngine machines.
The reason you have these are to:

  1. Eliminate the impact of slow network connections when you are not "close" to the application server.
  2. Execute more test threads than your local machine is capable of handling.

Note that if the GUI is running multiple remote servers, it can easily become a bottle-neck, especially if a lot of listeners are being used. Remove all unnecessary listeners before running stress tests.

Running JMeter in non-GUI (batch) mode is preferable, as this uses far fewer resources. The output log files can be merged after the test run and used to create overall test statistics. (CVS files can just be appended to each other; XML output files need a bit of editting to maintain well-formedness.)

If there are several nodes running the JMeter test plan, it is a good idea to try and ensure that their clocks are synchronised, as this makes it easier to analyse the data later.

How do I make parameters dynamic, reacting to the unique server responses of each test run?


Answer: You can use the Regular Expression Post Processor to extract a value from a response, and then reuse this response in another request. Looking at the previous question in this FAQ, you could extract the product id from the result and use it in the following request:

  1. Load Test Plan created in previous FAQ question
  2. Add Post Processor > Regular Expression Extractor to thread Group with following values:
    1. Reference Name: product
    2. Regular Expression: product_id=(\w*-\w*-\w*) 
    3. Template: $1$ 
    4. Match No.: 0  (Setting this parameter to 0 returns a random match)
  3. Copy the HTTP Request we created in the previous question and paste to the thread group after the previous HTTP Request
  4. Change the following values:
    1. Path: /estore/control/product 
    2. Add Parameter and set name to product_id , value to ${product }
  5. Save Test Plan
  6. Run > Start

When you view the results in the View Results Tree, you can see the ${product} value was replaced with the value extracted by the regular expression.

How can I display the response text my assertation runs against?


Answer:  You can display your server's response text in the View Results Tree listener.

What happens with redirects when asserting HTTP responses?


Answer:  Assertions aren't smart enough to do the right thing with redirected requests - currently the 302 response would be asserted against. You can get around this by recording your test plans and leaving "follow redirects" off.

Alternatively, the latest JMeter release (after 1.9.1) has an option to allow the redirects to be handled by the Java libary routines. Earlier versions of Java did not support redirects properly, but if you want to try, just define the following JMeter property:

 HTTPSampler.delegateRedirects=true 

JMeter will then not see the redirects at all.

How do I ensure each http request for jsp is within one jsessionid ?


Just insert an HTTP Cookie Manager. This keeps track of all cookies for each thread within the thread group. Without http cookie manager, each request is a new session as cookies are not kept. jsessionid is only shown for the very first request, subsequent request will not see the jsessionid. to use a variable in jmeter is ${name of variable}.

This is very useful when dealing with jsp form logins, as the first request is to login to the system and subsequent request is to do load testing on the target page. This will prevent redirection back into login page.

How do I ensure the remote jmeter server can communicate with the master client?


Sometimes java/rmi doesn't determine the correct IP address of your client. For example if you are communicating over a vpn under linux, the ppp interface is the IP that you want to use, but java may end up using the eth1 interface. If this is the case, you will see a connect exception in the jmeter-server log, which will mention an IP address different than the one you want it to use. You can force rmi to use a different IP address than the one it looks up by setting a system property: -Djava.rmi.server.hostname=192.168.5.6

Does JMeter process dynamic pages (e.g. Javascript and applets)


No. JMeter does not process Javascript or applets embedded in HTML pages.

JMeter can download the relevant resources (some embedded resources are downloaded automatically if the correct options are set), but it does not process the HTML and execute any Javascript functions.

If the page uses Javascript to build up a URL or submit a form, you can use the Proxy Recording facility to create the necessary sampler. If this is not possible, then manual inspection of the code may be needed to determine what the Javascript is doing.

JMeter keeps getting "Out of Memory" errors. What can I do?


This is usually caused by including memory intensive listeners in your stress test. Listeners like "View Tree Results" are useful for debugging your test, but they are too memory intensive to remain in your test when you ramp up the number of simulated users and iterations. The best listeners to use for a long-term, high-load test are Aggregate Listener, Graph Listener, and Spline Listener.

In addition, you can instruct the JVM to use more memory by editing the jmeter/jmeter.bat files for linux/windows. Within these files, find a section that sets values for the Heap:
set HEAP=-Xms256m -Xmx256m

Feel free to change these values. Xms indicates the starting RAM the jvm will take, and Xmx will be the maximum it is allowed (for the HEAP).

Apache Jmeter Distributed test with the latest version of java crashing issue

 Use jdk-8u202-windows-x64 for all the slave/master server to resolve this issue

Unix/Linux Commands

  Flow control Syntax break Exit a loop. continue Exit the current iteration of the loop and proceed with the next iteration. Ctrl+C Key com...